This article from HBR got me thinking – are we really setting ourselves up to make the most of data and analytics. If the potential on digital and data is to unlock the latent holistic value locked in processes and decisions within an organisation, perhaps the value of big data should be expressed with more than ‘it depends’
Quoting directly:
“Many scholars, from decision scientists to organizational theorists, have addressed this question from different perspectives, and the answer, as for most complex questions, is “it depends.” Big Data can lead to Big Mistakes. After all, the financial sector has been flooded with big data for decades.
A large body of research shows that decision-makers selectively use data for self-enhancement or to confirm their beliefs or simply to pursue personal goals not necessarily congruent with organizational ones. Not surprisingly, any interpretation of the data becomes as much an evaluation of oneself as much as of the data.”
Most often what harnessing big data allows us to do, is to make many small decisions. Its often the qualities of these decisions that underline the success of big data efforts by organisations.
How are data-driven (bad) decisions made:
Let’s look at a simple model:

- When the quantity of data is conflated with quality of data.
- When the quantity and quality of data stands in for the impact of said data.
- This impact can never be discreet – in vivo, factors are interdependent and influence each other.
- A large part of data driven understanding needs to be just that, how diverse phenomena (expressed as data) intersect and influence each other.
- If all three sufficient conditions (quality, quantity and impact) are met, the interpretation and execution of data become the limiting factors.
- Human Factors: Right mindsets and right methods cultivated across an organisation
- Organisation factors: Data warehousing and visualisation tools. Often the easiest to deploy, and again, often what organisations spend the maximum time on.
Understanding the role and impact given this data diversity is, for lack of a better word, Prime factor one.
How we set-up an organisation model where stakeholders and contributors are enabled and empowered to make data driven decisions is Prime factor two.
Prime factor 1: What is it that you should do, given all that you could do?
Countless marketing mix models have shown that the net impact of media on short term sales ranges from 9-14%. I could argue that the best analytics models determining the best budget mix can at best shift that needle a few percentage points. There is something called a PODR for data after all.
The answer, perhaps, lies in taking a lot more holistic view to data. Back to Quantity vs impact I suppose. Analysing your business models and seeking ways to transform, via data understanding, where the impact of Data Driven transformation can be highest.
If the role of media is to build short term demand; can data help us to meet that demand better. By revolutionising our supply-chain (uber-ising your distributor network)?
Given retailers and Credit card companies now know more about your consumers purchase behaviour, does the answer lie in better data, not bigger data? Through forming data cohorts perhaps?
A holistic understanding of data
Starts with, obviously, a thorough audit of your business model and business processes. Understanding the variables that impact each component of your business. And how they impact each other.
Data driven disruption is word often thrown about in any big data discussion. I suppose careers and made and unmade on how you play the big data bullshit bingo.
I believe it is this impish word that keeps a set of people nervous; and makes another set of people do tremendously unnecessary things around big data.
You don’t necessarily need to disrupt. The only thing mandatory here is change, Disruption is optional.
Again, understanding the stakeholders and components of your business should provide ample guidance of the quantum of change necessary or even, dare I say, sufficient.
In 1990, In 1990, Rebecca M. Henderson from MIT and Kim B. Clark from Harvard University wrote an interesting article, Architectural Innovation: The Reconfiguration of Existing Product Technologies and the Failure of Established Firms.
I am going to use a model they proposed to help explore the quantum of innovation needed.

- Incremental innovation introduces quality improvements in core components. The word renovation would more precisely describe this type of innovation.
- Modular innovation may result in the complete redesign of core components, while leaving linkages between the components unchanged.
- Architectural innovation changes the nature of interactions between core components, while reinforcing the core design concepts.
- Radical innovation introduces a new meaning, potentially a paradigm shift.
The above order also stands as a good guide for sizing and deploying big data across your organisation.
Not just that, I believe this framework can be deployed on individual functions within an organisation itself.
Prime factor 2: A tool is as good as the hand that uses it
Let’s say you have the right data systems in place. Good quality data with sophisticated algorithms producing actionable information. It will still need to be acted upon by people.
One thing that most organisations have found is that beyond an initial early user set of analytics mavens, the potential effectiveness and efficiency gains start decaying as the data adoption scales across teams.
As Sam Ransbotham, et. al. from the MIT SLOAN institute found in 2015 (Minding the analytics gap);
“ In an increasingly data-driven business environment, many executives must make critical decisions based on analyses that use data and statistical methods that they do not fully understand. How can executives with limited analytics expertise become adept consumers of analytics under such conditions? This question has become an important management issue as senior executives increasingly recognize the importance of analytics to creating business value.”
Quoting an example of the XL group in Ireland;
XL Group plc, a global insurance and reinsurance company based in Dublin, Ireland, is a case in point. Like others in the insurance industry, XL has long relied heavily on data analysis to understand and price its products. Actuarial science itself is rooted in using historical data to understand future risk and uncertainty. Across the insurance industry, companies have access to better data and more sophisticated methods of analysis than they did in the past; analyses of only a few years ago are no longer adequate to keep modern insurers competitive. In response, XL produces increasingly complex analytics, and demand for analytical insights progressively permeates the organization. According to Kimberly Holmes, senior vice president of strategic analytics at the XL Group, “An increasing number of managers must take action based on analytical results. But unlike the earlier adopters who embraced analytical approaches, these more recent adopters are not as well versed in the concepts, tools, systems and techniques of contemporary analytics. They are not comfortable making decisions based on analytical approaches that they do not fully understand. Yet they must still make these decisions.”
As part of this study, A survey of 2,719 managers in organizations from around the world — found that the foremost barriers to creating business value from analytics are not data management or complex modeling skills. Instead, the number one barrier by far in this year’s survey was translating analytics into business actions — in other words, making business decisions based on the results, not producing the results themselves. One survey respondent described his organization’s top analytical challenge as “developing middle management skills at interpretation.”
People, as a report by Forbes found, are the second largest limiting factor in Data Anayltics adoption:
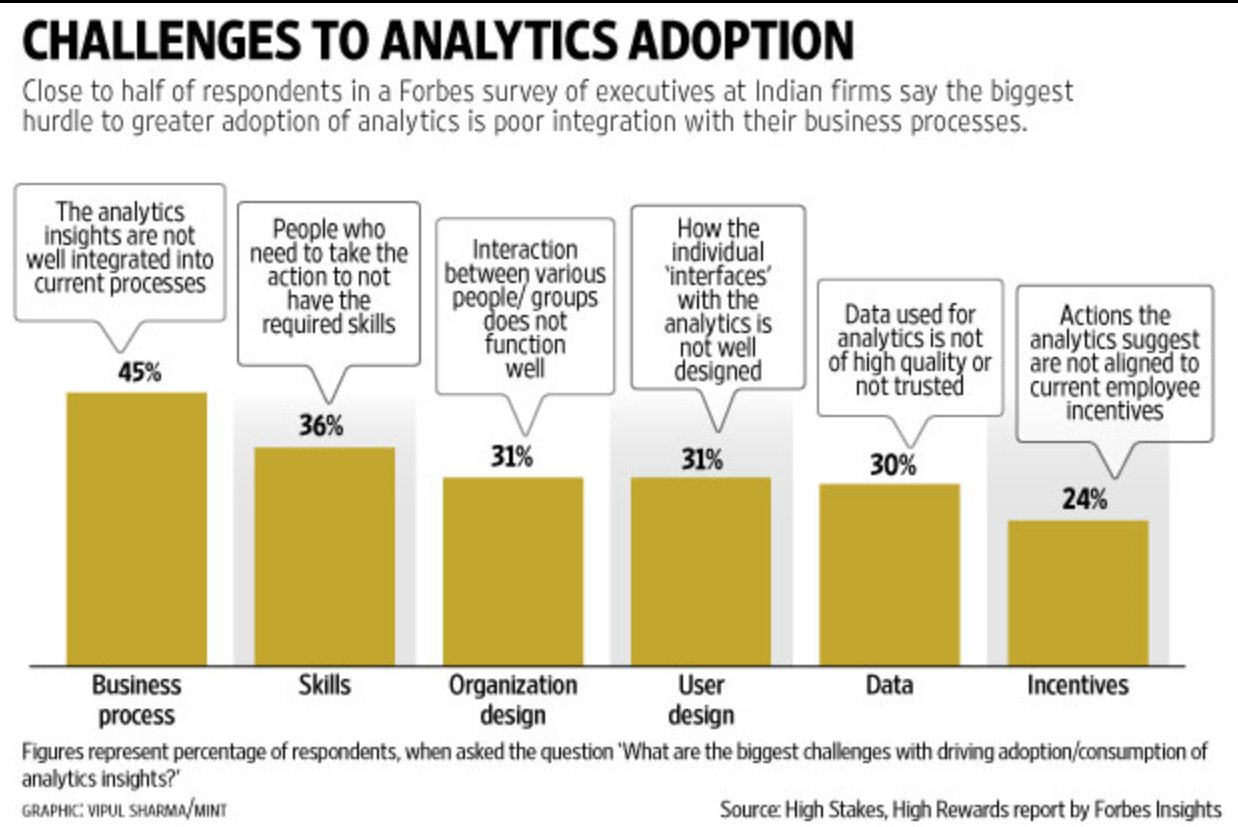
More so, given data diversity on one hand and the need to understand the interdependencies of data sets, perhaps the skill needed going forward is more about connecting the dots to improve the system as a whole.
The data expert of tomorrow will probably need to bring a lot more empathy to the business than just an appreciation of the empirical facts.
But first, there is still a need to scale analytical thinking and adoption within an organisation.
Everyone should know how data (& data tech) can improve efficiency and effectiveness – not just at a personal level, but for the department and subsequently for an organisation.
Let’s take Dynamic Creative Optimisation for instance. It’s where an algorithm, based on audience behaviour data among others, can insure the right creative is served to the right consumer. The innovation here is in the fact that these creatives are built on the fly, from a set of stock images, texts and dynamic elements. You could potentially have a customised campaign for every single consumer. The disruption here is in how this subverts the ideals and dogma of creative content generation – approval processes, legalese, copy checking etc etc.
The tech has existed for years now. However, Barring performance marketers, very few ‘brand’ advertisers have adopted this whole heartedly.
Perhaps the industry propagates this chasm between right and left brain thinking. Each side, holding hands, but at an arms length.
It’s a question of letting go of comfort, of adopting new habits, like perhaps taking up jogging.
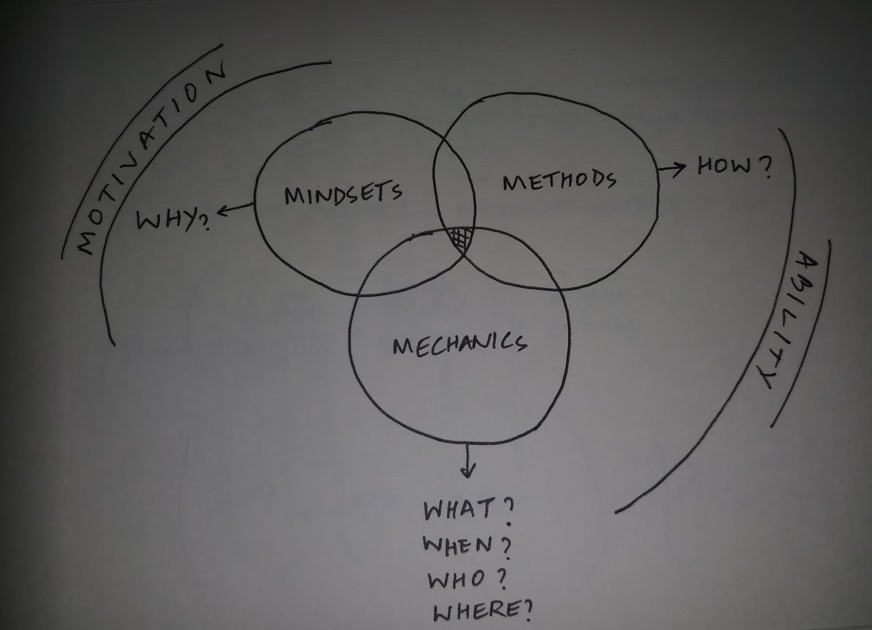
The answer lies perhaps in building not just ability, but motivation as well.
The first part is Motivation. Why you get out of bed every morning
This is the sermon of the ‘why’ – the reason to adopt a particular behaviour, or a new way of doing things. Building the right MINDSET precedes getting the right results.
Mindset change can only happen when the motivations become personal. And this personal motivation ladders up to a department or the organisation Data Manifesto. You can lead a horse to water etc…
Bill and Melinda gates foundation spent millions constructing toilets in rural India. There was a definite need among the poor for these toilets – open defecation was after all a major reason for the spread of communicable disease. What they found a few months later, was that a significant number of these toilets where not being used for the intended purpose. Perhaps as a store room, a pantry or a goat-house, but not as a toilet.
My point is that addressing need cannot be in isolation from addressing want.
The second is building ABILITY. Motivation without ability is frustration.
Ability comes from both Mechanics (what, when, who, where) and Methods (how). The right METHODS to be used, and the right MECHANICS of using them.
Scaling an understanding of mechanics makes it easy to do the right thing more often than not. Or in most cases, it reduces the instances of the wrong decisions or wrong interpretations of data.
The methods are the tools themselves. The right interfaces and visualisations. Presenting actionable data to the right person. Most data visualisation tools end up being too descriptive for general comfort. Good data tools are those with the right amount of information.
Better data tools are those which are prescriptive as well. If this, then that. Makes it easier for the non-analytics practitioner to make system aided informed decisions.
Great data tools – next level star trek type data tools – are perhaps those which go beyond descriptive and prescriptive to being predictive. All decisions come with an element of risk, and the right data tool minimises this risk at both micro and macro levels.
What do you think?
How can we make better decisions from data? From boardroom to backrooms?
Sid out.
Leave a Reply